

TLA continuously researches and monitors economic and market trends on behalf of the families we serve.
Note: In this Weight of the Evidence, I needed to go way outside of my comfort zone writing about technology. My colleagues at TLA all know that while they all live and work with ease on the Information Superhighway, I’m generally more comfortable inside the information cul-de-sac.
Where the Rubber Meets the Road
I’ve been reading a historical book that takes place in Shanghai. Having emerged as a traditional fishing town in the 11th century, by the 19th century Shanghai grew to become the largest city in China. Known as the Paris of the Orient, Shanghai became a center of commerce for European, Middle Eastern, and Japanese merchants, entrepreneurs, and bankers. A thriving stock market soon developed. About the same time, a brand new technology promised to change not only transportation, but society as a whole — the automobile. The Ford Motor Company began mass-producing the Model-T. General Motors followed suit in the U.S., and in Europe, Peugeot, Mercedes-Benz, Fiat, Opel, and Renault were all manufacturing automobiles. Word got out that a Japanese company would soon be manufacturing cars as well.
While each car company had a unique manufacturing process, they all had one thing in common — they needed rubber for tires. Entrepreneurs seeing this great opportunity soon developed rubber plantations in Malaysia, Ceylon ( Sri Lanka), and The Dutch East Indies (Indonesia). Bankers in Shanghai created stock companies to own and transport rubber products. Seeing current sales and anticipating future needs, investors began to bid up the prices of rubber stock companies. A buying frenzy soon developed. Bankers not only lent money directly to the rubber companies, but also lent money to investors so that they could buy more and more shares at higher and higher prices. Success soon bred competition as more rubber plantations and transporters began operating and issued shares. In January 1910, ten new rubber companies existed in Southeast Asia. Then the price of rubber, which had been surging, suddenly plummeted due to increased global competition. By June of that same year, the bottom fell out of the rubber market. 8 Chinese banks soon dissolved. By the end of the crisis, 48 of Shanghai’s 91 banks had collapsed. Most of the early bondholders and shareholders were wiped out by the end of 1910. As it turns out, in the long run, the investment thesis was correct. The rubber plantations continued to operate and supply rubber products, and within a few years demand for rubber skyrocketed, once again exceeding supply, when The Great War broke out, and the need for motorized transportation increased. Automobile usage worldwide grew from 500,000 in 1910 to over 9 million in 1920. Unfortunately, the successful monetization of the investments came too slowly for those earlier investors.
Here’s the rub: Not all great ideas are profitable; at least not right away.
Fast forward several decades. The late 1990s saw mass commercialization of the internet. Engineers properly foresaw the growing need to replace slower, older copper and satellite networks with super-fast fiber-optic cables. In 1997, Global Crossing invested a few hundred million dollars to lay fiber optic cable under the Atlantic Ocean. Solomon Brothers & Merrill Lynch took Global Crossing public in 1998, raising $400 million. The stock peaked at over $50B. Global Crossing borrowed heavily to build out 100,000 miles of fiber, expecting to generate more than $100 million a month in revenue. Like the rubber plantations in Southeast Asia in the early 20th century, success generates competition. AT&T and MCI soon created a joint venture to compete, which soon forced a 90% reduction in the price of the fiber optic cable. With severely compressed profit margins, Global Crossing could not pay off the debt and declared bankruptcy in 2002. Everything Global Crossing forecast about undersea demand happened, but at way lower prices. The natural evolution of technology is competition and price cuts.
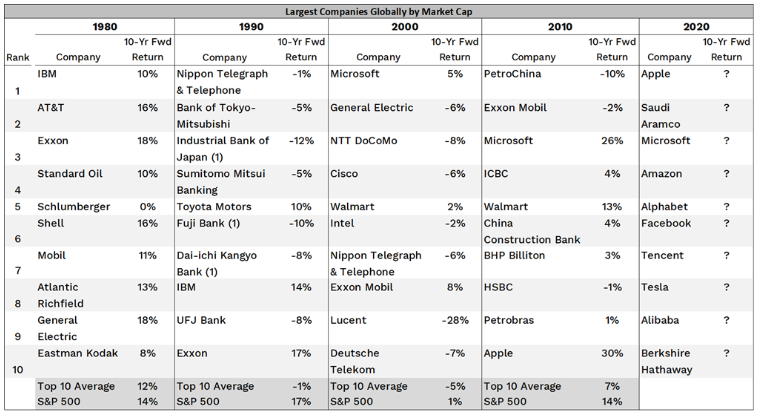
The chart below shows the 10-largest companies in the world at the beginning of each decade since 1980, as well as the investment return each produced in that decade. Perhaps surprisingly, each decade’s group of top-10 underperformed the broad index over the next decade. The way they got to the top-10 was by generating superior gains in the previous decade. The lesson for investors is that it’s very hard to stay on top for long. Peak confidence is often associated with peak price levels.
Source: Bloomberg and Charlie Biello
Outside My Cul-de-sac
Which brings us to the latest hot technology — Artificial Intelligence (AI). AI is real. It will transform society as other technological breakthroughs have done. Think about the printing press, the steam engine, electricity, and the transistor, among many others. The AI boom has captured the imagination as well as trillions of dollars of speculative investment. Recently, a point of tension has come into focus between the durability of earnings momentum in the near term and the ability of AI investments to deliver broad-based, sustainable profitability in the medium term. Elevated earnings expectations seem to already be priced in, while the path for sustained return momentum beyond the near term may be narrow.
The first half of 2026 saw enormous amounts of capital expenditures (CapEx) on the buildout of AI capabilities across industries, which has helped bolster overall economic growth. This has generated a significant tailwind for the markets as well.
Driving the growth of AI are so-called Hyperscalers — massive, well-known companies that design, own, and operate data centers to provide cloud computing at scale. Think of it this way: AI builds the intelligence; hyperscalers make it work.
Just 5 hyperscalers are expected to spend roughly $765 billion on AI-related infrastructure in 2026. That’s about 2% of U. S. GDP (equivalent to the amount invested in railroad expansion in the 1850s) and a more than 80% increase from last year. Goldman Sachs estimates that hyperscaler’s CapEx is on track to reach 75% of operating cash flow by year-end, a ratio similar to tech company spending in the late 1990’s. Like the dot-com infrastructure companies 25 years ago, these hyperscalers may have little choice but to spend aggressively to defend their positions. This historic scale of investments by hyperscalers may raise questions about whether returns will ultimately justify the capital deployed.
It’s no wonder investors continue to pile in: Wall Street analysts are getting more optimistic about AI all the time. AI infrastructure stocks have seen 2026 earnings estimates revised higher by more than 50% since December 2024, while the S&P 500, excluding AI infrastructure, has seen estimates actually move down slightly.
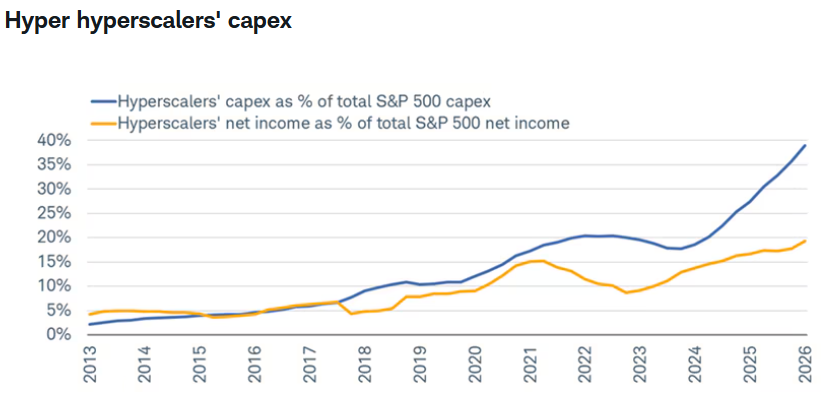
One data point to keep an eye on in the structural features of the current AI investment cycle is the widening spread between hyperscalers’ share of S&P capex and their share of S&P 500 income. As you can see in the graph, hyperscaler capex has been growing significantly faster than net income, as compared to the other companies in the S&P 500.
Source: Charles Schwab and Strategas
Economic Resiliency and Inflation
Partially due to all of the AI spending, the U. S. economy continues to surprise to the upside. Corporate profits have been extraordinary and may even be accelerating. Over the past year, the economy has defied the most dire predictions related to tariffs, the government shutdown, war in the Middle East, the oil price shock, deportations, a trade war with China, and DOGE.
Inflation remains an area of ongoing concern. Virtually every measurement of inflation has not only exceeded the Fed’s 2% target, but has recently been accelerating. We’ll have to wait and see if the ceasefire in the Middle East mitigates that any time soon. Gasoline prices seem to ride up elevators, but down escalators.
New Fed Chair Kevin Warsh has promised that the Federal Open Market Committee “will deliver price stability.” Workers don’t feel like they have much bargaining power, so the labor market has not been generating as much inflation pressure as it did a few years ago. On the other hand, AI’s explosive growth is creating supply-chain bottlenecks and inflation pressure due to increasing demand for limited physical resources of energy, raw materials, and construction.
Inflation pressures are likely to remain sticky, with core inflation now expected to finish the year above 3%.
A third of small business owners said in May that they intend to increase prices just to keep up with inflation; the highest reading since 2022.
Job Market
The May payroll report headline may have exceeded expectations, but the underlying quality of job creation was very weak — almost 80,000 full-time jobs lost and 266,000 part-time jobs created. June numbers also appear to be quite sluggish. And for those with a job, inflation wiped out more than a year of wage gains, meaning purchasing power isn’t keeping up with the cost of living for most families. That partially explains why household savings rates recently hit a multi-decade low of 3%, even after the OBBBA tax refunds. The long-term historical average is over 8%.
Markets
A primary driver of equity prices is corporate earnings, and they have been impressive. Not only that, earnings have been broadening out beyond the narrow tech-related areas that have driven the market. Earnings so far have defied virtually every cautious forecast at the beginning of the year.
Another primary driver of equity prices is psychology. Rising markets make everyone feel better, but they also come with higher expectations. As an example of expectations, Canada just won its first World Cup game ever. While Canadian fans’ expectations were likely very low going into the World Cup, they will likely be very disappointed if they don’t now win the championship.
While market valuations have come down due to excellent earnings, they remain above long-term averages. When markets are priced for optimism, it doesn’t take bad news, only less good news, to trigger volatility.
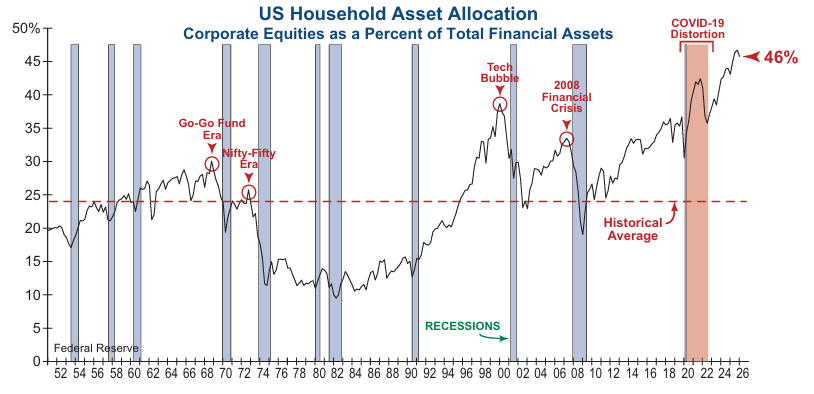
What is the current level of optimism today? Just look at the chart below showing the percentage of financial assets invested in stocks at any given time. As you can see, it’s now at an historic high.
Source: Federal Reserve and Investech
As we’ve discussed before, gambling, disguised as investing, becomes most popular closer to market peaks. Two of the latest offerings qualify for “silly season.” One fund invests in cryptocurrencies, but only at night. The other invests in “unidentified anomalous phenomena.” No word yet on what time of day they appear.
The Hidden Cost of Cash
Let’s shift from financial bungee-jumping to hiding under the mattress. You no doubt know someone who has been scared by headlines, liquidated their investments, and gone to cash. $5.6 trillion, or 10% of Americans’ wealth, is currently in low-yielding bank deposits. Over time, the opportunity cost of holding cash may actually exceed that of poor timing in the stock market. Why? Inflation and taxes. An all-cash portfolio loses buying power every year, month, and day. Even bad timing, which we never recommend, may outperform cash. For example, according to Fidelity Investments, someone who invested $5000 in U.S. stocks annually from 1980 to 2023 on the worst possible day each year would have grown that investment to $4.2 million. That assumes perfectly bad annual timing. Conversely, leaving the money in cash throughout that span would have turned into just $350k. Of course, both would have been subject to income taxes, but for most people, equities are taxed at a lower rate than whatever income cash generates. Cash has a place in portfolios, but its allocation should be intentional, not by default.
Staying Defensive
Conflicts, whether political, military, or otherwise, create uncertainty. An effective way to navigate that uncertainty is to maintain a diversified portfolio. That used to mean stocks and bonds because they were non-correlated. In other words, their trends were not parallel to each other. Several years ago, we observed that stock and bond markets were becoming more correlated to each other, meaning they were more often moving in the same direction. To address this phenomenon, we added less or non-correlated alternative solutions to our portfolios, designed to create an asymmetrical portfolio that allows growth while “buffering” downside risk.
Fourth of July
Best wishes for a happy, healthy, and safe holiday as we celebrate our nation’s 250th birthday!
– Andrew T. Gardener, CFP®